Observatoriet
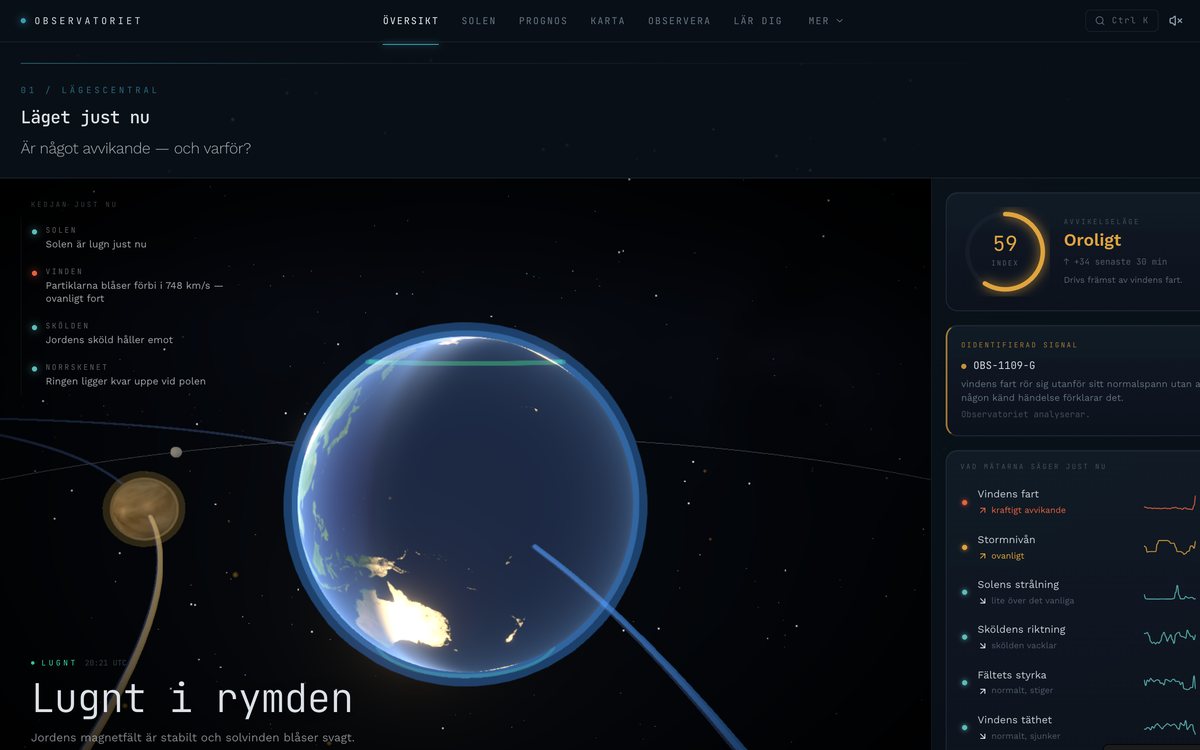
Observatoriet shows what is happening between the Sun and Earth right now. It reads live data from NOAA's space weather centre and NASA's Solar Dynamics Observatory, flags when something leaves its normal range, and explains why in a sentence anyone can follow.
- Year
- 2026
- Status
- In progress
- Stack
 React
 Three.js
 Supabase
 Lovable
- What I built
- I designed and built it in Lovable: the overview, the 3D scene, the explanations, and pages for past events, an aurora map, live solar images and a storm explainer.
How it works
- 01
The data is live: solar wind, the magnetic field, the Kp index and X-ray flux from NOAA's Space Weather Prediction Center, and solar images from NASA's Solar Dynamics Observatory.
- 02
The overview follows the chain in four steps, the Sun, the solar wind, Earth's magnetic shield and the aurora, each in one plain sentence.
- 03
An anomaly index says whether any channel has left its normal range, and a panel explains why: how fast the solar wind is, which way the field points, and how close Kp is to storm level.
- 04
A 3D scene shows Earth, the line to the Sun and the inner solar system, with asteroids and comets you can switch on.
- Decision 1
Explain before you measure: every number comes with a sentence saying what it means.
- Decision 2
Follow the chain, not the instruments: Sun, wind, shield, aurora, in that order.
Happy to walk through the thinking, the trade-offs and where it's headed next.
Get in touch